Predicting growth in children - part 2/2
In the previous post I talked about a Kaggle competition in which we had to build a model to predict certain factors that affect children’s health in Argentina. I wrote about some exploratory analysis on the problem and today I continue with those ideas, now applied to a model.
Datasets
In the last episode (?), we saw we have some kind of “history” on each patient: we have some rows corresponding to different checkups for the same patient. Now we can try to build another dataset that takes advantage of this “patient history”.
On the training set, we have some patients with four check-ups and the rest have only three check-ups. For those with only three measurements, the fourth one can be found in the test set. If I grab all the patients with four check-ups on the train set, I can concatenate the check-ups for the same patient together into only one row.
Now we have a dataset made of a history of four check-ups per row.
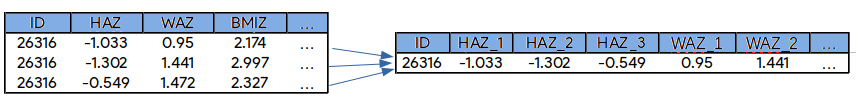
For example, given one patient, I can concatenate all four check-ups into only one row. The clear advantage of this is that I have way more information on the patient on each row: all the HAZs. WAZs, BMIZs, etc into one row. I’m leaving out the patients with only three check-ups because I don’t have information on the “decae” variable for the fourth check-up (because it’s in the test set). So, this means that now I have a much smaller train set, 6200~ versus the original 42000~.
Another thing I can do is, instead of concatenating all four check-ups, I concatenate only three per row as in the image. This way I can now use the check-ups 1, 2, 3 of each patient and I can also use the patients I couldn’t use before because I don’t need that fourth check-up . With this approach I have twice as much training rows, 12000~.
I also kept the original dataset to use for training. I think it can’t hurt to train a separate model with it.
From now on I’ll name these datasets: 4-dataset, 3-dataset and original dataset respectively.
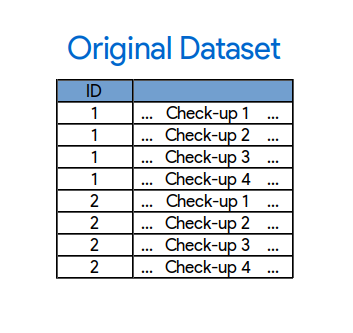 Original dataset: one per row
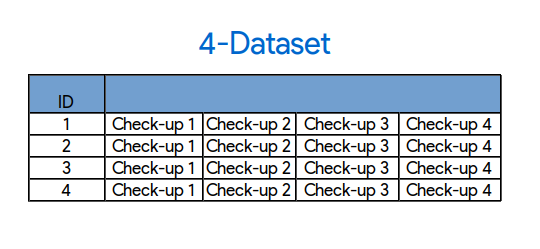 4-dataset: One row with four check-ups
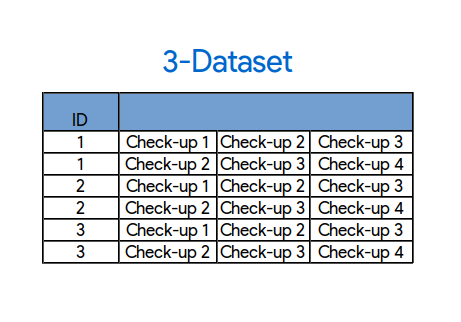 3-dataset: Two rows for the same patient
Those are the main three datasets I used in my final solution, but on the journey I made a lot more of (failed) experiments.
Now is also time to add some more work to our pipeline (remember we had a end to end pipeline from the last post). With scikit-learn we can automatically divide the train datasets into three parts: train/test/validation. This will become super handy because we leave the original test set untouched, meaning that we won’t overfit to the test data.
Another basic thing is to have a cross validation method (also coming almost for free in scikit) to check for an estimation of our score locally.
I ran each dataset on our basic pipeline one at a time, and submitting the solution for the 4-dataset resulted in a score of 0.785. The last score was 0.77043 so this is a nice improvement!
Pulling features out of my hat
Ok, we have our pipeline working, explored our data, made maps and created new datasets. Now what? We can start looking into making new features and transforming the existing ones into a better representation for the classifier.
The features I’ll end up adding are based on the map data we talked about in the last post, combinations of the original features and insights from other studies on the same subject. Some of these worked flawlessly and others were terrible.
Let’s start with the map data we talk about earlier. I used what I saw that time on the map to clusterize “by hand” the hospitals and ended up making fourteen different regions.
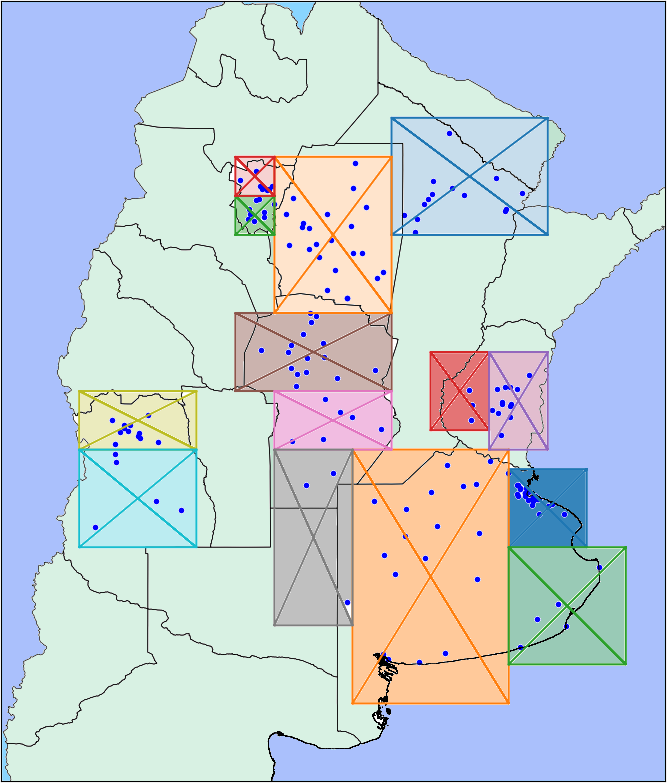
It was a promising idea but sadly it didn’t work at all. The gradient boosting method I’m using as model, lets you look at which features were more important at the moment of taking a decision. This new clusterization ended up not being important at all.
On the other hand, another approach consisting on having the proportion of “decae” = true/false for each hospital was surprisingly good. This feature improved the overall score.
In the 4-dataset, I had four instances of HAZ, WAZ and BMIZ over time. I wanted to use this information, and to let know the classifier that those values are related somehow. I came up with a function that, for each row, adjusts a linear regression over these four values and adds the slope and intercept of the fitted line as new features.
Here you can play a bit with some of the results:
Patient ID: [[{curr+1}]]
Decae: [[{datasets[curr][12]}]] [[{datasets[curr][12]}]]
I also added second grade polynomic features based on HAZ, WAZ and BMIZ. This means to take each of the features and multiply them by all others (including itself). In my particular case, in the 4-dataset for example, I took HAZ_1, …, HAZ_4 and combined them into the following features:
The same process was applied to WAZ_1…WAZ_4 and BMIZ_4…BMIZ_4. This added 30 new features in total.
The problem we’re studing, the one of children growth, must be a common one and other articles and papers must exist on the subject. In fact there’re a lot. This one in particular caught my attention because it tries to solve a very very similar problem on children in Ethiopia. I took a result from that paper: a rule that stated that an individual is malnourished if
and
with the standard deviation.
They claim this rule alone classified correctly 99.7% of their instances (!). This seems like magic, so why not? Let’s try it. I adjusted a bit those values and created a feature based on the rule which, out of lack of a better name, I called it “Magic”. It ended up as one of the most important features in my model.
| Name | Description |
|---|---|
| region_n | 1 if the hospital belongs to region , 0 if not. |
| p | proportion of decae=true for the hospital |
| HAZ_x * HAZ_y | Polynomical features for HAZ |
| WAZ_x * WAZ_y | Polynomical features for WAZ |
| BMIZ_x * BMIZ_y | Polynomical features for BMIZ |
| HAZ/WAZ/BMIZ_x_linear_reg_slope | Slope of the regression line for HAZ/WAZ/BMIZ |
| HAZ/WAZ/BMIZ_x_linear_reg_intercept | Intercept of the regression line for HAZ/WAZ/BMIZ |
| magic | and |
Combining everything
Until now, I’ve been running each of these datasets separately and submitting those solutions. One idea in machine learning that works very well is to “combine” several models into a better model. There are different approaches to do this like boosting, bagging and stacking. Our base model, Gradient Boosting, already uses this idea by having an ensamble of trees internally.
To combine my models I used stacking. This means making a new dataset from the solutions of other models, and running another classifier on top of that.
    <a class='fancybox-thumb ' id="model1" title="Several independent models and their predictions"
       data-thumb="/assets/eci/model1.png" href="/assets/eci/model1.png" rel="models">
        <img alt="model1" src="/assets/eci/model1.png">
        <span class="fancy-caption">Several independent models and their predictions</span>
    </a>


    <a class='fancybox-thumb ' id="model2" title="Final stacking model"
       data-thumb="/assets/eci/model2.png" href="/assets/eci/model2.png" rel="models">
        <img alt="model2" src="/assets/eci/model2.png">
        <span class="fancy-caption">Final stacking model</span>
    </a>
So what I’m combining here? Like I said, I’ve been running each of the datasets described with a simple gradient boosting algorithm. What I’ll do is to get all those predictions and make a new dataset with each prediction as a feature column and I’ll run a prediction algorithm on that to get the final result.
So, I’ve described three datasets until now: 4-dataset, 3-dataset and the original one. But I can play a little more with this. Let’s remember our target variable definition:
| Decae (Target variable) |
It takes the value "True" if at least one of the following conditions occurs:
{
HAZ >= -1 and next_HAZ < -1
WAZ >= -1 and next_WAZ < -1
BMIZ >= -1 and next_BMIZ < -1
|
Ok, something that we can see here is that everything depends on the value of the previous check-up: if HAZ/WAZ/BMIZ was below -1 (the first part of the condition), “decae:” will always be false regardeless of the value of the next check-up. This is very restrictive and probably confuses our algorithm.
What happens if I remove this restriction? For each of my datasets I made another one where the target variable doesn’t have this condition. This means that “decae” will be independent of previous values, it will only depend on the new checkup. I had three datasets and I duplicated them so now I have datasets.
Going further, I made other datasets but instead of removing the restriction for all variables, I removed it for one variable at a time. For example, I made a new data set removing the restriction on HAZ but keeping WAZ and BMIZ untouched. That’s three more datasets for each one of the originals: .
One last idea, I can try to predict our target variable using only one column of the original dataset at a time. For example, trying to predict “decae” only by looking at the date of birth, then by looking only at the region, etc. Each of these predictions by themselves is very bad, but I combined the results into a new dataset, having each prediction as a feature column. Yes, it’s the stacking idea again, I made a smaller stacked model to use on our final bigger stacking model.
This brings the total to sixteen different models. Like I said before, I put each of the individual predictions of each of the sixteen datasets as columns of a new final dataset and I predict that set with yet another model (that ended up being gradient boosting again, but with other hyperparameters).
This seventeenth model was my final one.
Adjusting knobs
Finally, let’s improve and optimize everything. I have seventeen models made of Gradient Boosting with default parameters. This algorithm has several hyperparameters to play with and I think this is the right time to start with this task. I have the impression that it’s common (and I did it myself in the past) to start adjusting the parameters very early when working on a project, even before having an end-to-end pipeline working (I talked a bit about this earlier). The problem with this is that you can waste a lot of time trying to improve something that will change pretty soon. So, I like to have a solid and well thought solution before start optimizing.
Finding hyperparameters is basically an automated process. These hyperparameters take different range of values, for example number of trees on an ensamble (integer) or learning rates (float from 0 to 1). Scikit has methods to automate the process, like GridSearchCV or RandomizedSearchCV. If you specify a set of possible values for each parameter, the first method searches all the combinations of the parameters that you want, performing a Cross Validation using your model and reports the best set of parameters that it found. It is slooooow.
The latter doesn’t try everything, you have to specify how many times you want the algorithm to run and it chooses a random subset of your parameters each round. It is way faster but I don’t find it good enough.
I came up with a custom method that worked for me. I don’t know if it is something that already exists and I just reinvented the wheel or something. Or maybe is just a bad idea overall and I just got lucky this time. My method is a greedy search over the space of hyperparameters:
- For each parameter, I assign a set of possible values
- I take one parameter randomly
- I try all values assigned to that parameter and keep the one that got the best score
- I continue from (2) having that parameter fixed
I run this times and I keep the best generated model. Yes, I know, it is shady at least but in practice it did work for me and was very very fast (if I’m not mistaken, for n being the total number of values I can try for the hyperparameters).
I ran this until I felt the results were good enough and then submitted.
My previous score was 0.785 and my final score…* drumroll *…. 0.78998.
Conclusion
I finished the competition 18th of 40 participants. It’s not the position I’d liked, but it’s ok and I learned a lot along the way:
-
Having a pipeline end to end as a first priority is good. But after that, I would have wanted to give a better look at the data. For example, next time I’ll try to classify by hand some examples to see if I can discover a pattern or take a look to the more extreme cases of each class. The brain is more powerful than any algorithmic predictor.
-
I can reuse my code for another competition, I think at least the structure is usable and I’ll save a lot of time.
-
Model stacking works well, but I had a hard time coding it. Next time I’ll think my code better knowing that I’ll have to use my results for a stacked model.
-
Finally, I have my not-so-scientifically-probed-but-good-in-practice-greedy-cross-validation method that helped me this time. It may not be the best alternative, but I kinda grew fond of it.
The interesting thing about this problem is that these results (and others by other participants) can be really useful in public health. With more information, like for example data about the mothers, we’ll surely can get a better score and better predictions.
It would be awesome if something like this ends up being used by doctors and help children before they even start having some kind of problem.
That’s all, thanks for reading!